The Effect of Age and Gender on Work Preferences
Gender Analysis
Differences between men and women has long been a topic of debate. Indeed within the Team Management Systems (TMS) network, there have been many requests for data on gender differences. In response to these requests we have analyzed the worldwide database of over 519,000 respondents to determine what differences, if any, exist between males and females.
While the ethical guidelines, which are agreed to by every accredited facilitator, make very clear that the Team Management Profile Questionnaire never be used as the sole criterion for selection, appraisal and placement decisions, and the nature of TMS methodology is to stimulate further discussion rather than be prescriptive, it is nevertheless very useful to be aware of the relationship of gender to work preferences as measured by the Team Management Profile Questionnaire. Development samples for the Team Management Profile Questionnaire included a large proportion of females and the items were screened carefully for any gender bias. To a large extent this has assured a test that is free of bias.
The sample analyzed here is comprised of subjects who have completed the Team Management Profile (TMP) as part of training programs, specific research projects, and on an ad hoc basis. They represent a wide variety of professional areas, industries, functional areas of management and nationalities. All subjects from the worldwide database who provided information on their gender (n=476,879) are included in this report.
Table 1 reports the means and standard deviations of the work preference measures for the total worldwide sample and Table 2 shows the results for male and female respondents.
Please Note: The sample size of the major worldwide database cannot be taken as an indicator of the number of profile questionnaires completed worldwide.
Table 1. Work preference scale means and standard deviations: total worldwide sample (519,303)
Table 2 reports the means and standard deviations of the work preference measures for male and female respondents.
It should be noted that there is a slight difference on the A-B scales where males return a significantly higher Analytical score than females. All the other differences are minimal and if any real differences do exist they are fairly insignificant for practical purposes.

Table 2. Work preference scale means and standard deviations: worldwide gender samples
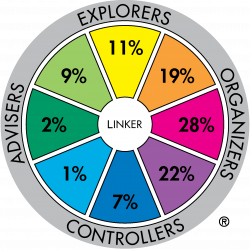
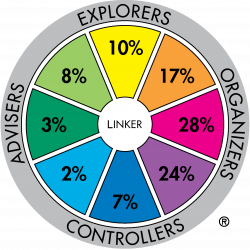
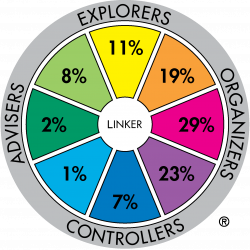
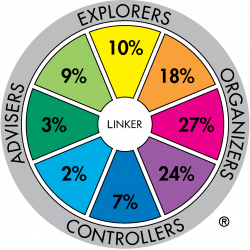
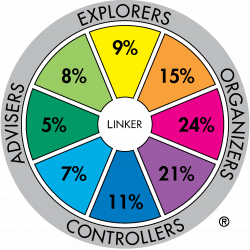
The major role preferences for gender samples are presented in Figures 1 and 2. It should be noted that titles of major role preferences are not reproduced for clarity reasons and that rounding errors may occur.
It can be noted from Figures 1 and 2 that, as with the work preference scale comparison for gender, there are only minor differences between males and females.
Figure 1. Major role preference distribution for worldwide Male sample (n=276,671)
Figure 2. Major role preference distribution for worldwide Female sample (n=200,208)
Reliability testing was conducted on both male and female samples during the development of the Team Management Profile Questionnaire. It is interesting to note that among the group of females tested, Cronbach alpha values approached or exceeded those of the male sample, suggesting that females were answering items more consistently (in psychometric terms) than males.
While there are some small differences between the work preferences of males and females as measured by the Team Management Profile Questionnaire, these are quite small. The most significant difference is the more Practical and Beliefs based mean scores for the female sample. An analysis of the reliability of the Team Management Profile Questionnaire scales for women suggests that the items of the Team Management Profile Questionnaire are being perceived in a similar way by both men and women.
Age Group Analysis
Previous age research has shown that the Team Management Profile Questionnaire is reliable for all age groups. Additionally, reliability increases with age, possibly due to the greater chance of workers experiencing several types of work and being in a better position to identify their preferences consistently.
Table 3 displays the means and standard deviations of the major Team Management Profile Questionnaire sample broken down by age groups. We have included the data on the age group 70-79, although this is not a significant sample on which to pass judgement. Obtaining relevant data from those who have left the work force is hard to come by.
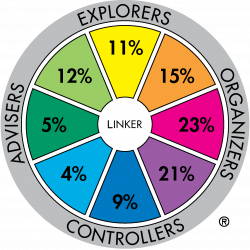
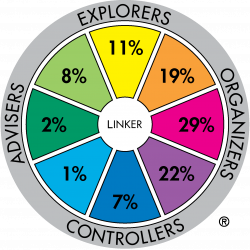
Here we see the mean score for Extroversion-Introversion becoming more Introverted with age. The Practical score also appears to increase with age. The Analytical score declines with age, as people become more Beliefs-based. There is also a slight shift in the Structured-Flexible scores towards being more Structured as age increases.
This trend towards Introversion, Beliefs and Structure may be interpreted by some as a reflection of the ‘creeping conservatism’ of aging while others may interpret it as the result of experience and the decrease in importance of experimentation at older ages.
In interpreting these results, care should be taken to remember that we are not measuring the same people over time and factors such as the changing management beliefs and methodologies over the past 60 years have not been taken into account. It should also be noted that the differences found are small and the effect may be negligible in many circumstances. Nevertheless these results may facilitate useful discussion on age and work preferences.

Table 3. Work preference scale means and standard deviations: worldwide age group samples
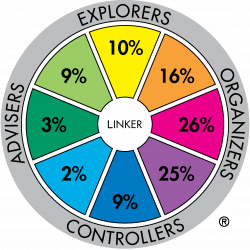
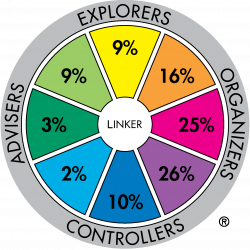
Figure 4. Major role preference distribution for worldwide age group sample: under 20 (n=994)
Figure 5. Major role preference distribution for worldwide age group sample: 20-29 (n=56,521)
Figure 6. Major role preference distribution for worldwide age group sample: 30-39 (n=114,034)
Figure 7. Major role preference distribution for worldwide age group sample: 40-49 (n=99,649)
Figure 8. Major role preference distribution for worldwide age group sample: 50-59 (n=45,951)
Figure 9. Major role preference distribution for worldwide age group sample: 60-69 (n=5,703)
Figure 10. Major role preference distribution for worldwide age group sample: 70-79 (n=150)
References:
- Davies, R.V., (1988/89), The Margerison-McCann Team Management System: Research Manual 1988/89, Graduate School of Management, University of Queensland.
- Team Management Systems (1998), Team Management Systems Research Manual: Second Edition, Brisbane, Australia.
- McCann, D.J., & Mead, N.H.S., (Eds.), (2003), Team Management Systems Research Manual: 3rd Edition, Team Management Systems, Brisbane, and York.
- McCann, D.J., & Mead, N.H.S., (Eds.), (2018), Team Management Systems Research Manual: 5th Edition, Team Management Systems, Brisbane, and York.
Copyright © Institute of Team Management Studies. All rights reserved.


