Research Manual 5th Edition - Country Analysis
Country Analysis
RM5 has a worldwide country database of 202 countries where the Team Management Profile has been used. An analysis is available for 48 countries with 300 or more respondents. Key points are:
- The highest mean Extrovert-Introvert scores recorded are for Denmark (E=8.4) and Malaysia (I=0.5).
- There are also significant differences on the P-C scale where the highest mean C scores are for the Scandinavian countries of Denmark (C=2.6), Sweden (C=1.9) and Finland (C=1.5), compared with more Practical scores from Hong Kong (P=4.1) and Ireland (4.0).
- On the A-B scale the mean scores ranged from Germany (A=6.1) to Nigeria (A=15.9) and Mexico (A=14.4), a significant difference of 9.8 points.
- The S-F scale has a 6.6 point range from Japan (S=3.0) to Chile (S=9.6) and Mexico (S=9.0)
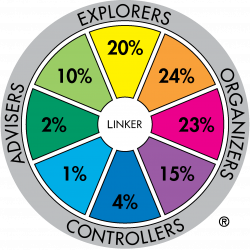
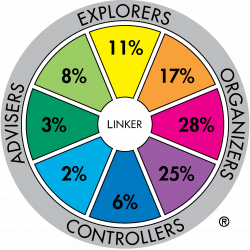
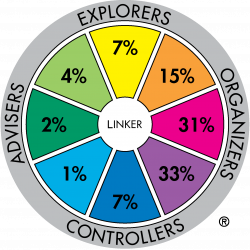
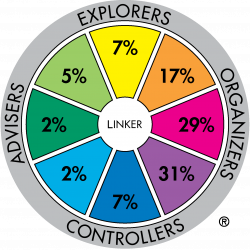
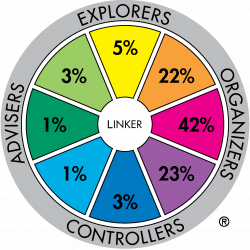
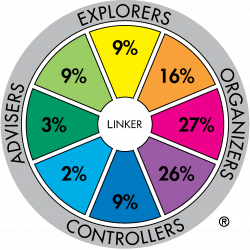
Mean major role preference percentages for Denmark, Malaysia. Hong Kong, Germany, Mexico, and Australia are shown in the diagrams below. Some observations are:
- Denmark has a much greater percentage of Explorer-Promoters (20%) than the other country samples. Lowest countries are the Philippines (4%) and Mexico (5%)
- Mexico also had the greatest percentage of Thruster-Organisers (42%), compared with Denmark at 23%.
- Sweden, Netherlands, Switzerland, Denmark and USA have the highest percentage of Creator-Innovators with 10% each compared with Mexico and Turkey both at 3%.
- Turkey has the highest percentage of Assessor-Developers (31%) closely followed by Sweden, Croatia, Poland and Russia at 28%. The lowest figures (15%) are for Hong Kong and Ireland..
- An equally wide range in representations can be seen for the Concluder-Producer role. The highest percentages were Hong Kong (33%), Philippines (32%) and Malaysia (31%) and lowest for Denmark and Sweden, both 15%.
This analysis highlights key differences between countries. For example, in Denmark 30% of people working there had preferences in the Creator-Innovator and Explorer-Promoter sectors. Similar data was recorded for other Scandinavian countries. Compare this with Malaysia (12%), Mexico (8%) and even Australia at 18%.
Figure 1. Major role preference distribution for country sample: Denmark (n=1254)
Figure 2. Major role preference distribution for country sample: Germany (n=15,476)
Figure 3. Major role preference distribution for country sample: Hong Kong (n=2208)
Figure 4. Major role preference distribution for country sample: Malaysia (n=1723)
Figure 5. Major role preference distribution for country sample: Mexico (n=1143)
Figure 6. Major role preference distribution for country sample: Australia (n=149,359)
References:
- McCann, D.J., & Mead, N.H.S., (Eds.), (2018), Team Management Systems Research Manual: 5th Edition, Team Management Systems, Brisbane, and York.
Copyright © Institute of Team Management Studies. All rights reserved.


